


Aug 13, 2026 2:16 PM
Updated Aug 14, 2026 9:18 AM
This article was originally published by Nik on Curve News.
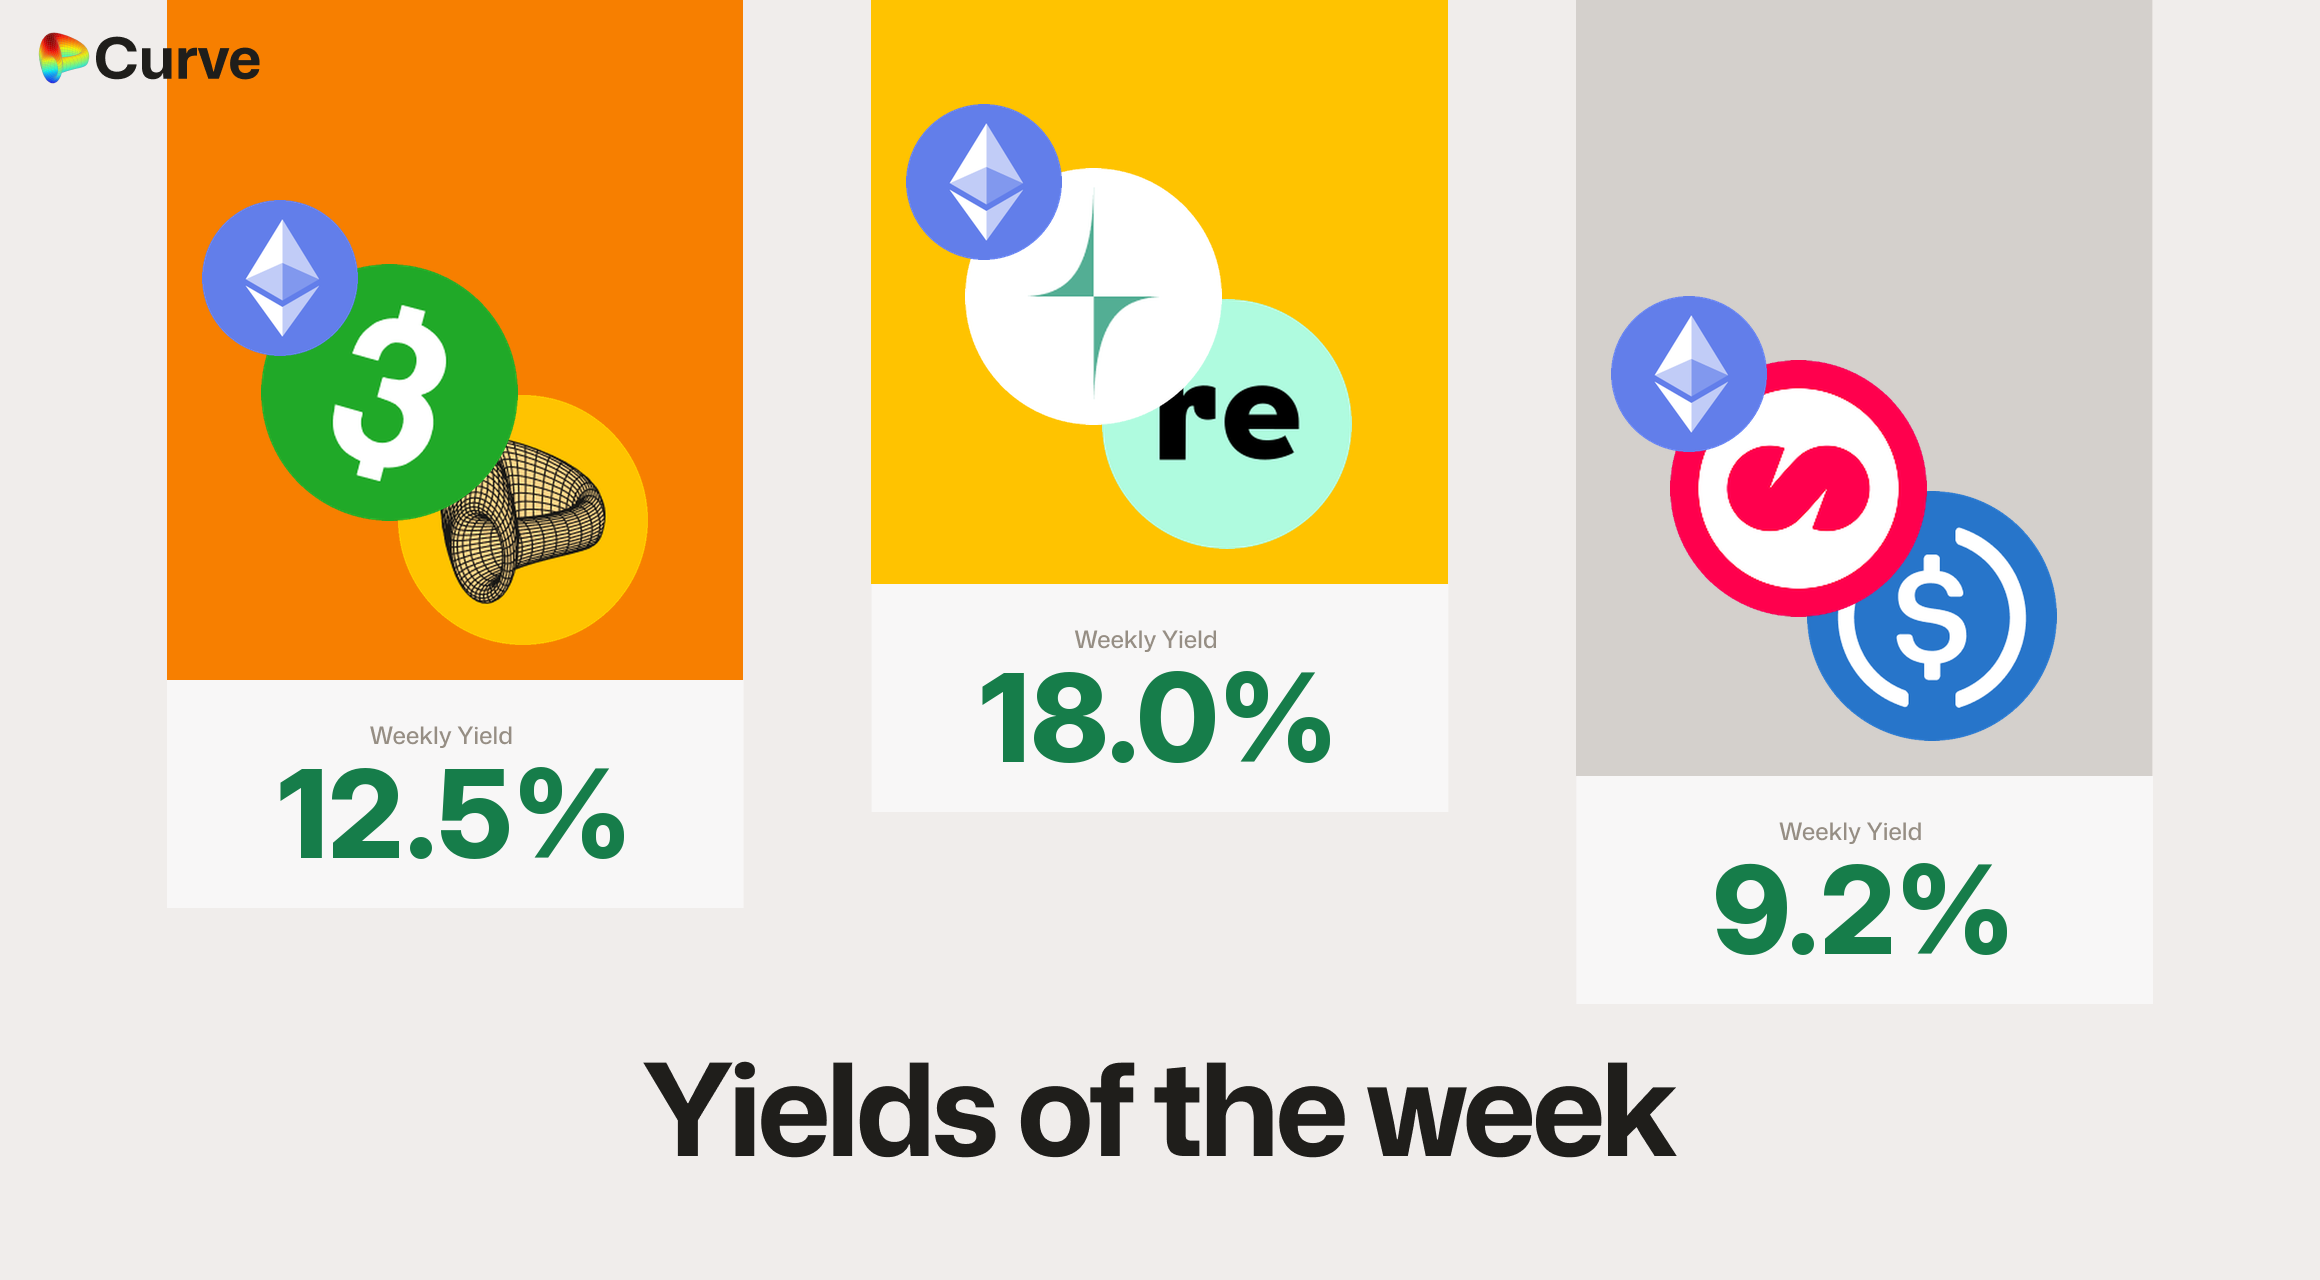 Curve Best Yields & Key Metrics | Week 33, 2026
Weekly yield and Curve ecosystem metric updates as of the 13th August, 2026
Top Yields: 1st. sUSG/reUSD Pool on Ethereum with 18.0% Yield, 2nd. USD3/scrvUSD Pool on Ethereum with 12.5% Yield, 3rd. MUSD/USDC/USDT Pool on Ethereum with 9.2% Yield
Market Overview
Welcome to another weekly newsletter. Here's the news:
- Llamalend grew on every measure: supply up 22.7% to $77.1M, borrowing up 13.3% to $97.7M, TVL up 12.3% to $164M, and 1,094 loans open
- The svZCHF/crvUSD market went live on Llamalend V2 with a 500,000 crvUSD borrow cap: vote 1474 executed on the 12th of August
- CRV entered its sixth mining epoch on the 12th of August: daily emissions stepped down 15.91%, from 316,563 to 266,197 CRV. The step is written into the token contract, runs every 365 days and does not change how emissions are split between gauges
- crvUSD minting grew 5.3% to $39.8M, the average borrow rate held at 2.1% and PegKeeper reserves stayed at $33.8M
- Robinhood Chain enters the fee table: Curve's new deployment contributed $118.7k of this week's pool fees, second only to Ethereum
- Eight non-binding preference votes on risk-provider candidates opened on the 10th of August, each candidate with its own vote, alongside a separate add-on proposal
As always, see all the highlighted opportunities and weekly metrics below.
Top Yields
Top USD Yields
All yields are calculated assuming a minimum of $100k TVL.
Note: yields are shown as the rate a new $100k deposit would actually receive: base fees plus unboosted CRV gauge rewards plus any live Merkl campaign, diluted by the deposit itself.
| Chain | Market | Type | Yield |
|---|---|---|---|
 |  sUSG  reUSD | Pool | 18.0% |
|  USD3  scrvUSD | Pool | 12.5% |
|  MUSD  USDC  USDT | Pool | 9.2% |
|  frxUSD  USD3 | Pool | 8.5% |
| frxUSD  sGho | Pool | 7.8% |
| frxUSD  sUSDe | Pool | 7.6% |
| USD3  sUSDS | Pool | 7.5% |
| frxUSD  DUSD | Pool | 7.2% |
|  apyUSD  apxUSD | Pool | 7.1% |
|  crvUSD  fxSAVE | Llamalend | 6.8% |
Top BTC & ETH Yields
All yields are calculated assuming a minimum of $100k TVL.
ETH pairs hold the top of this table: ETH/ETHx leads on 5.4%, with alETH/WETH on Arbitrum at 4.6%. The BTC side is quieter, topping out at 3.3% on the WBTC/cbBTC/hemiBTC pool.
| Chain | Market | Asset | Yield |
|---|---|---|---|
|  ETH  ETHx | ETH | 5.4% |
 |  alETH  WETH | ETH | 4.6% |
|  WBTC  cbBTC  hemiBTC | BTC | 3.3% |
| cbBTC WBTC | BTC | 3.1% |
 |  frxETH  sfrxETH | ETH | 3.1% |
 |  cbBTC  WBTC  LBTC | BTC | 1.4% |
Other Top Yields
All yields are calculated assuming a minimum of $100k TVL.
CRV liquid-locker pairs pay the most here, CRV/sdCRV at 11.4% and CRV/yCRV at 7.5%. Among the non-dollar currencies, crvUSD/CJPY offers 5.6% and crvUSD/ZCHF 3.5%; the gold pair XAUt/PAXG remains close to zero at 0.1%.
| Chain | Market | Asset | Yield |
|---|---|---|---|
|  CRV  sdCRV | CRV | 11.4% |
| CRV  yCRV | CRV | 7.5% |
| crvUSD  CJPY | FOREX | 5.6% |
|  GHO cbBTC  WETH | TRICRYPTO | 4.5% |
| crvUSD  ZCHF | FOREX | 3.5% |
 |  EURe  WXDAI  USDC  USDT | FOREX | 2.1% |
|  XAUt  PAXG | GOLD | 0.1% |
Top Llamalend Supply Yields
All yields are calculated assuming a minimum of $100k TVL.
Supply rates use the same basis as the table above: base lending rate plus unboosted CRV gauge rewards plus any live Merkl campaign, diluted for a $100k deposit. Markets that are more than 95% lent out are left off: the rate they show falls away as soon as new money arrives.
| Chain | Market | Supply Rate |
|---|---|---|
| crvUSD fxSAVE | 6.8% |
 |  USDC  wstETH | 5.3% |
| USDC  WBTC | 5.1% |
| crvUSD  sDOLA | 5.0% |
| crvUSD  syrupUSDC | 4.9% |
| crvUSD  sfrxUSD | 4.3% |
|  crvUSD WETH | 4.1% |
| crvUSD  WBTC | 4.0% |
| crvUSD sUSDe | 3.5% |
| crvUSD WETH | 3.4% |
Weekly Metrics
crvUSD & scrvUSD
crvUSD minting grew 5.3% to $39.8M while the average borrow rate held at 2.1% and PegKeepers kept $33.8M in reserves. The scrvUSD savings yield edged up to 1.5%, while the share of minted crvUSD sitting in savings fell 4.9 points to 43.1% as new minting outpaced deposits. crvUSD trades at $0.9991. Minting fees came to 14.9k crvUSD on the week, down 2.6%.
| Metric | Value | Change |
|---|---|---|
| crvUSD Minted | $39.8M | +5.3% |
 scrvUSD Yield | 1.5% | +0.2% |
| crvUSD in scrvUSD | 43.1% | -4.9% |
| crvUSD Price | $0.9991 | -$0.0001 |
| Avg. Borrow Rate | 2.1% | +0.1% |
| Peg Stability Reserves | $33.8M | - |
| PegKeeper Profit | $520 | -$565 |
| Fees | $14.9k | -2.6% |
Llamalend
Llamalend TVL rose 12.3% to $164M, the one part of the protocol that grew this week. Supply led at +22.7% to $77.1M, ahead of debt at +13.3% to $97.7M, so deposits came in faster than they were borrowed; collateral rose 10.1% to $144M and the loan count reached 1,094. Fees paid to the protocol were $470 for the week. Only the V2 markets pay a share of interest to the DAO, so only those are counted here; in the older markets all of the interest goes to lenders.
| Metric | Value | Change |
|---|---|---|
| 🦙 Llamalend TVL | $164M | +12.3% |
| 🦙 Supplied | $77.1M | +22.7% |
| 🦙 Borrowed | $97.7M | +13.3% |
| 🦙 Collateral | $144M | +10.1% |
| 🦙 Loans | 1094 | +24 |
| 🦙 Fees | $470 |
DEX
Robinhood Chain enters the fee table. Curve's new deployment contributed $118.7k of this week's pool fees, second only to Ethereum. With it counted, DEX fees finished the week flat at $237k, up 0.9%, and the swap count rose 20.9% to 459k. Volume fell 24.9% to $536M. Set Robinhood aside and the established chains had a soft week: the single largest move is USDC/sUSDat, which turned over $117M less than last week, $129.8M down to $13.1M. That volume left on its own: the pool traded $53.3M on the 30th of July and was down to $0.3M a day by the 8th of August. Vote 1473 raised that pool's swap fee from 0.01% to 0.50%, but it executed on the 11th of August, when most of the volume had already gone. TVL was flat at $1.43B. Note that the fee line here counts DEX pool fees only; crvUSD minting fees and Llamalend fees are shown separately in their own sections above.
| Metric | Value | Change |
|---|---|---|
| 🔄 TVL | $1.43B | -0.7% |
| 🔄 Volume | $536M | -24.9% |
| 🔄 Swaps | 459k | +20.9% |
| 🔄 Total Fees | $237k | +0.9% |
DAO
veCRV distribution fell 41.8% to $41.6k, taking the veCRV APR down to 1.088%, following the lower fees on the established chains described above. CRV locked holds at 851M with 781M veCRV outstanding, and weekly emissions were $529k (2.22M CRV), up 16.0% on a higher CRV price. CRV entered its sixth mining epoch on the 12th of August, and daily emissions stepped down from 316,563 to 266,197 CRV, a cut of 15.91% written into the token contract. The 4.799% in the table annualises the week just gone, almost all of which ran at the old rate; at the new rate a year of issuance is 97.2M CRV, or 4.03% of supply.
| Metric | Value | Change |
|---|---|---|
| CRV Circ. Supply | 1.55B | +0.1% |
| CRV Locked | 851M | - |
 Total veCRV | 781M | -0.2% |
| veCRV Distribution | $41.6k | -41.8% |
| veCRV APR | 1.088% | -1.168% |
| CRV Emissions | $529k (2.22M CRV) | +16.0% |
| Inflation Rate | 4.799% | -0.004% |
Top Stableswap Pools
DAI/USDC/USDT moved up one place to the top on $54.2M, with USDG/USDC three places up at #2 on $47.7M and WETH/weETH also three places up at #3 on $24.4M. The sharpest climbers were further down the table: USD1/USDC/USDT rose eighteen places to #10 and trUSD/USDC twelve places to #9.
| 📍 | 🔄 | Chain | Pool | Volume | Fees |
|---|---|---|---|---|---|
| 1 | +1 | |  DAI USDC USDT | $54.2M | $8.1k |
| 2 | +3 | |  USDG USDC | $47.7M | $4.8k |
| 3 | +3 | | WETH  weETH | $24.4M | $1.3k |
| 4 | +6 | | USDC  RLUSD | $22.8M | $4.6k |
| 5 | +4 | | USDC  USDat | $22.5M | $2.3k |
| 6 | -3 | |  PYUSD USDC | $21.7M | $2.2k |
| 7 | +1 | | USDT crvUSD | $19.7M | $2.0k |
| 8 | -4 | | USDC USDT | $17.2M | $364.3 |
| 9 | +12 | |  trUSD USDC | $15.1M | $1.5k |
| 10 | +18 | |  USD1 USDC USDT | $14.1M | $130.9 |
Top Cryptoswap Pools
The two TriCrypto pools swapped places once more, USDC/WBTC/WETH taking #1 on $8.7M ahead of USDT/WBTC/WETH on $7.4M. crvUSD/WETH/CRV holds #3 on $5.3M. Volumes shown are weekly totals.
| 📍 | 🔄 | Chain | Pool | Volume | Fees |
|---|---|---|---|---|---|
| 1 | +1 | | USDC WBTC WETH | $8.7M | $3.5k |
| 2 | -1 | | USDT WBTC WETH | $7.4M | $3.2k |
| 3 | +1 | | crvUSD WETH CRV | $5.3M | $3.3k |
| 4 | -1 | | EURe WXDAI USDC USDT | $2.1M | $726.1 |
| 5 | +1 | | WETH  CVX | $1.9M | $8.4k |
| 6 | -1 | | crvUSD  tBTC  wstETH | $1.1M | $1.2k |
Gauge Winners & Losers
ETH/ETHx took the largest gauge weight gain (+1.82k), followed by the new crvUSD/svZCHF market (+1.71k), which earns emissions from its first week, before any supply has arrived. On the other side, DOLA/sUSDe shed the most (-29.7k), with FRAX/USDe and reUSD/scrvUSD both down 22k.
| 📍 | Chain | Pool / Market | TVL | CRV Emissions | Change |
|---|---|---|---|---|---|
| 1 | | ETH ETHx | $205k | 1.82k | +1.82k |
| 2 | | crvUSD  svZCHF | $0 | 1.71k | +1.71k |
| 3 | |  OUSD  eUSD | $4.27k | 67.4 | +67.4 |
| ... | ... | ... | ... | ... | ... |
| -3 | |  FRAX  USDe | $34M | 117k | -22k |
| -2 | |  reUSD scrvUSD | $9.26M | 117k | -22k |
| -1 | |  DOLA sUSDe | $46.8M | 155k | -29.7k |
DEX Winners & Losers
Fees Winners & Losers
WETH/CVX added the most fees (+$5.01k) on $1.93M of volume, with crvUSD/YB up $2.67k and crvUSD/WETH/CRV up $1.72k. USDC/sUSDat gave back the most (-$14.8k), in line with its lost volume, with frxUSD/msUSD (-$9.59k) and WETH/USDC (-$5.9k) next.
| 📍 | Chain | Pool | Volume | Fees | Change |
|---|---|---|---|---|---|
| 1 | | WETH CVX | $1.93M | $8.37k | +$5.01k |
| 2 | | crvUSD  YB | $980k | $3.5k | +$2.67k |
| 3 | | crvUSD WETH CRV | $5.34M | $3.3k | +$1.72k |
| ... | ... | ... | ... | ... | ... |
| -3 |  |  WETH  USDC | $1.58M | $3.16k | -$5.9k |
| -2 | | frxUSD  msUSD | $1.42M | $2.21k | -$9.59k |
| -1 | | USDC  sUSDat | $13.1M | $1.63k | -$14.8k |
Volume Winners & Losers
USDG/USDC added the most volume (+$16.7M), followed by USD1/USDC/USDT (+$10.5M) and trUSD/USDC (+$9.9M). USDC/sUSDat lost $117M, four times the next-largest decline, with DAI/USDC/USDT (-$29.8M) and PYUSD/USDC (-$19.2M) behind it.
| 📍 | Chain | Pool | Volume | Fees | Change |
|---|---|---|---|---|---|
| 1 | | USDG USDC | $47.7M | $4.82k | +$16.7M |
| 2 | | USD1 USDC USDT | $14.1M | $131 | +$10.5M |
| 3 | | trUSD USDC | $15.1M | $1.53k | +$9.9M |
| ... | ... | ... | ... | ... | ... |
| -3 | | PYUSD USDC | $21.7M | $2.23k | -$19.2M |
| -2 | | DAI USDC USDT | $54.2M | $8.12k | -$29.8M |
| -1 | | USDC sUSDat | $13.1M | $1.63k | -$117M |
TVL Winners & Losers
DOLA/sUSDe drew the biggest TVL inflow (+$5.87M), ahead of OETH/WETH (+$4.24M) and crvUSD/WBTC (+$2.12M). NUSD/USDC saw the largest exit (-$3.51M, leaving $27k behind), with crvUSD/cbBTC (-$2.67M) and USD0/bUSD0 (-$1.96M) next.
| 📍 | Chain | Pool | TVL | Change |
|---|---|---|---|---|
| 1 | | DOLA sUSDe | $46.8M | +$5.87M |
| 2 | |  OETH WETH | $46.7M | +$4.24M |
| 3 | | crvUSD WBTC | $50.5M | +$2.12M |
| ... | ... | ... | ... | ... |
| -3 | |  USD0  bUSD0 | $1.75M | -$1.96M |
| -2 | | crvUSD cbBTC | $82.6M | -$2.67M |
| -1 | |  NUSD USDC | $27k | -$3.51M |
Llamalend Winners & Losers
crvUSD Minting Markets - Borrowing Winners & Losers
cbBTC led crvUSD borrow growth (+$979k), with wstETH (+$511k) and WBTC (+$342k) behind it. Repayments were negligible this week: no crvUSD minting market gave back more than $5.
| 📍 | Chain | Market | Collateral | Borrowed | Change |
|---|---|---|---|---|---|
| 1 | | crvUSD cbBTC | $8.97M | $5.49M | +$979k |
| 2 | | crvUSD wstETH | $23.5M | $11.1M | +$511k |
| 3 | | crvUSD WBTC | $30.2M | $15.2M | +$342k |
| ... | ... | ... | ... | ... | ... |
| -3 | | crvUSD weETH | $325k | $154k | +$51 |
| -2 | | crvUSD  LBTC | $2.66 | $1.08 | +$0.00237 |
| -1 | | crvUSD  sfrxETH | $305k | $154k | -$4.35 |
Lend Markets - Borrowing Winners & Losers
sreUSD led new Llamalend borrowing (+$5.1M), with sfrxUSD (+$4.95M) and the new syrupUSDC market (+$1.24M) next. Note that sfrxUSD appears on both sides of this table, and they are two different markets: the V2 market opened in July added $4.95M, while the original market from February 2025 repaid $3.8M.
| 📍 | Chain | Market | Supplied | Borrowed | Change |
|---|---|---|---|---|---|
| 1 | | crvUSD  sreUSD | $25.4M | $24.2M | +$5.1M |
| 2 | | crvUSD sfrxUSD | $9.62M | $7.5M | +$4.95M |
| 3 | | crvUSD syrupUSDC | $3.56M | $1.69M | +$1.24M |
| ... | ... | ... | ... | ... | ... |
| -3 | | crvUSD WBTC | $4.12M | $3.19M | -$29k |
| -2 | | USDC WBTC | $380k | $303k | -$328k |
| -1 | | crvUSD sfrxUSD | $11.7M | $9.03M | -$3.8M |
Lend Markets - Supplying Winners & Losers
sfrxUSD drew the most fresh supply (+$6.33M), followed by sreUSD (+$3.3M) and sUSDe (+$3.21M). As with borrowing, the two sfrxUSD markets moved in opposite directions: the V2 market took in $6.33M while the original one gave back $4.53M, so much of this is rotation rather than new capital.
| 📍 | Chain | Market | Supplied | Borrowed | Change |
|---|---|---|---|---|---|
| 1 | | crvUSD sfrxUSD | $9.62M | $7.5M | +$6.33M |
| 2 | | crvUSD sreUSD | $25.4M | $24.2M | +$3.3M |
| 3 | | crvUSD sUSDe | $6.45M | $2.22M | +$3.21M |
| ... | ... | ... | ... | ... | ... |
| -3 | | USDC wstETH | $360k | $309k | -$92.7k |
| -2 | | USDC WBTC | $380k | $303k | -$511k |
| -1 | | crvUSD sfrxUSD | $11.7M | $9.03M | -$4.53M |
Explore Yield Oppportunities
Go to DEX markets
Go to Lending Markets
Go to Savings crvUSD
Risk Disclaimer
References to specific pools or Llamalend markets do not constitute endorsements of their safety. We strongly encourage conducting personal risk analysis before engaging with any pools or markets. Please review our detailed risk disclaimers: Pool Risk Disclaimer, Llamalend Risk Disclaimer, crvUSD Risk Disclaimer.
Comments

Powered by RoundtableBuilt on infrastructure designed for real-time media. Learn more at RTB.io.© Roundtable 2026. By using this site you agree to the Terms of Use and Privacy Policy