Logo
CurveCurve
Aug 27, 2026 1:37 PM
Updated Aug 28, 2026 9:18 AM

Weekly yield and Curve ecosystem metric updates as of the 27th August, 2026

This article was originally published by Nik on Curve News.

This week in 60 seconds

  • Top pool APYs: sUSG/reUSD at 23.7%, MUSD/USDC/USDT at 22.8%, and OUSD/USG at 17.6%.
  • Yield quality: most leading USD rates are incentive-driven; sUSG/reUSD has the strongest disclosed fee component.
  • Lending: the highest listed supply rates are 6.7% for USDC/WBTC and crvUSD/svZCHF.
  • Protocol: PegKeeper reserves rose to $65 million, with crvUSD at $0.9998 at the snapshot.
  • Governance: yRisk was selected as risk assessor, with funding under vote.

This week's takeaway: most leading USD rates depend more on incentives than trading fees. sUSG/reUSD is the exception among the highlighted pools, with 8.98 percentage points of its 23.66% rate coming from fees.

Top yields
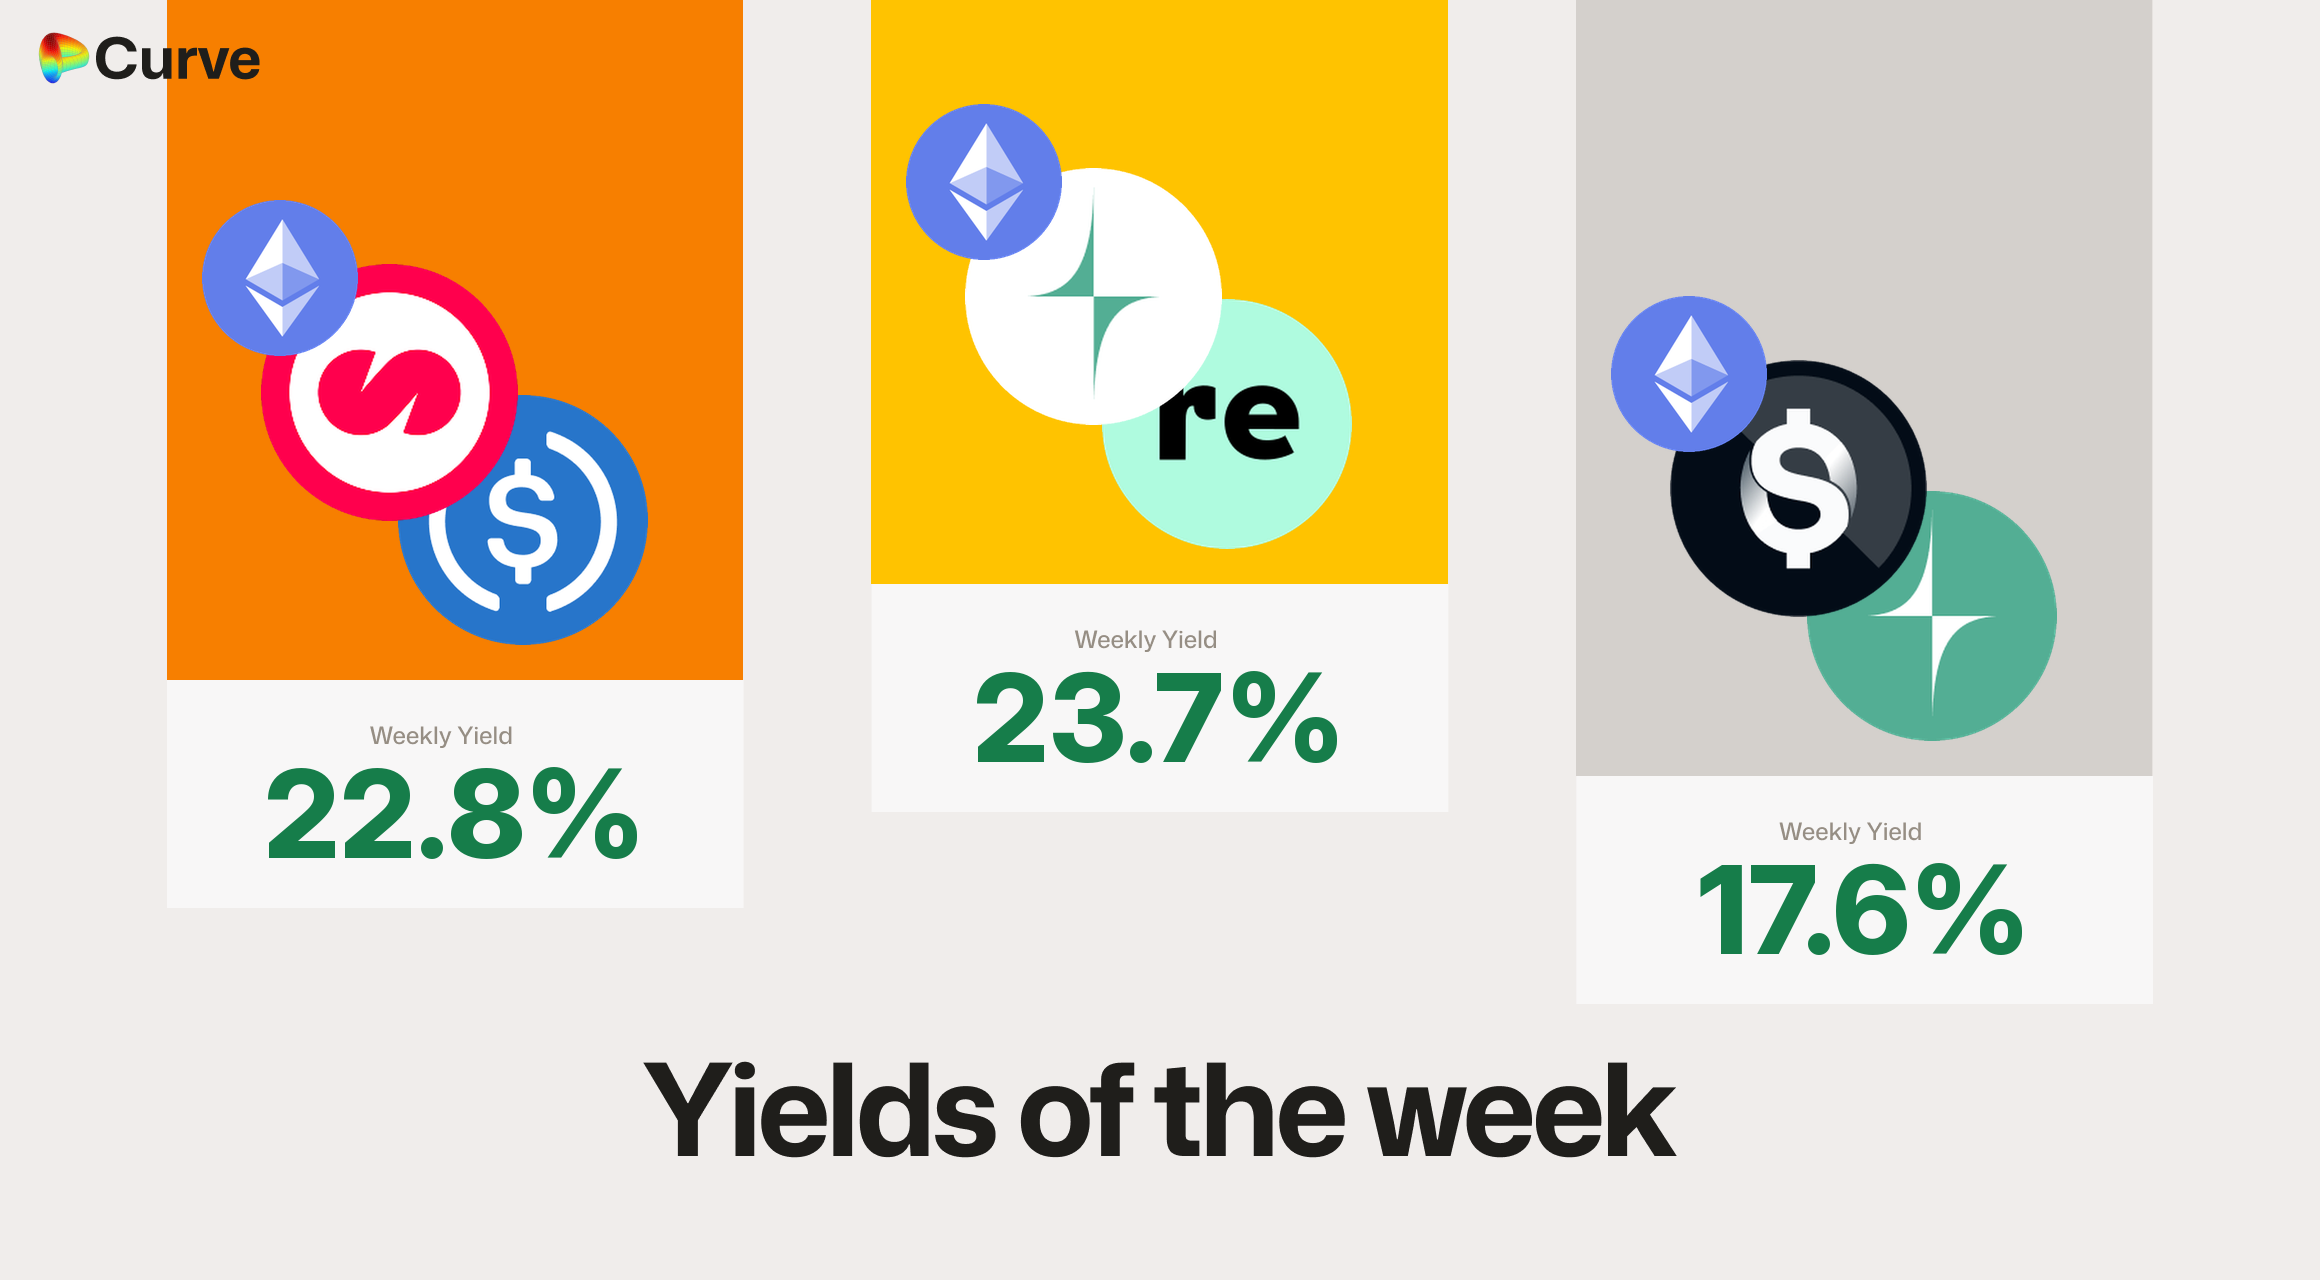
Curve Best Yields & Key Metrics | Week 35, 2026Curve Best Yields & Key Metrics | Week 35, 2026

Rates are estimated annualized returns for a modeled $100,000 deposit after pool dilution. They include base fees, unboosted CRV and active Merkl rewards where applicable. Rates are variable and not guaranteed. Data snapshot: 27 August 2026.

Top USD Yields

ChainMarketTypeEst. APY
Curve Best Yields & Key Metrics | Week 35, 2026Curve Best Yields & Key Metrics | Week 35, 2026 sUSG Curve Best Yields & Key Metrics | Week 35, 2026 reUSD (Re Protocol)Pool23.7%
Curve Best Yields & Key Metrics | Week 35, 2026Curve Best Yields & Key Metrics | Week 35, 2026 MUSD Curve Best Yields & Key Metrics | Week 35, 2026 USDC Curve Best Yields & Key Metrics | Week 35, 2026 USDTPool22.8%
Curve Best Yields & Key Metrics | Week 35, 2026Curve Best Yields & Key Metrics | Week 35, 2026 OUSD Curve Best Yields & Key Metrics | Week 35, 2026 USGPool17.6%
Curve Best Yields & Key Metrics | Week 35, 2026Curve Best Yields & Key Metrics | Week 35, 2026 frxUSD Curve Best Yields & Key Metrics | Week 35, 2026 USGPool17.1%
Curve Best Yields & Key Metrics | Week 35, 2026Curve Best Yields & Key Metrics | Week 35, 2026 USDC Curve Best Yields & Key Metrics | Week 35, 2026 USGPool15.0%
Curve Best Yields & Key Metrics | Week 35, 2026Curve Best Yields & Key Metrics | Week 35, 2026 evaUSDC Curve Best Yields & Key Metrics | Week 35, 2026 USDCPool12.8%
Curve Best Yields & Key Metrics | Week 35, 2026Curve Best Yields & Key Metrics | Week 35, 2026 evaUSDT Curve Best Yields & Key Metrics | Week 35, 2026 USDTPool11.5%
Curve Best Yields & Key Metrics | Week 35, 2026Curve Best Yields & Key Metrics | Week 35, 2026 BOLD Curve Best Yields & Key Metrics | Week 35, 2026 LUSDPool10.7%
Curve Best Yields & Key Metrics | Week 35, 2026Curve Best Yields & Key Metrics | Week 35, 2026 USG Curve Best Yields & Key Metrics | Week 35, 2026 sDOLAPool10.1%
Curve Best Yields & Key Metrics | Week 35, 2026Curve Best Yields & Key Metrics | Week 35, 2026 USDC Curve Best Yields & Key Metrics | Week 35, 2026 sUSDatPool9.9%

What supports the leading rates: MUSD/USDC/USDT earns 0.27% in base fees against 22.57% in incentives. frxUSD/USG earns 0.25% in base fees against 16.88% in incentives. The relevant pools range from $0.65 million to $2.38 million. sUSG/reUSD is more fee-supported, with 8.98 percentage points of its 23.66% rate coming from fees.

Related stories

Top Llamalend Supply Yields

Top BTC & ETH Yields

ChainMarketAssetEst. APY
Curve Best Yields & Key Metrics | Week 35, 2026Curve Best Yields & Key Metrics | Week 35, 2026 ETH Curve Best Yields & Key Metrics | Week 35, 2026 ETHxETH7.7%
Curve Best Yields & Key Metrics | Week 35, 2026Curve Best Yields & Key Metrics | Week 35, 2026 alETH Curve Best Yields & Key Metrics | Week 35, 2026 WETHETH4.5%
Curve Best Yields & Key Metrics | Week 35, 2026Curve Best Yields & Key Metrics | Week 35, 2026 pufETH Curve Best Yields & Key Metrics | Week 35, 2026 wstETHETH3.1%
Curve Best Yields & Key Metrics | Week 35, 2026Curve Best Yields & Key Metrics | Week 35, 2026 WBTC Curve Best Yields & Key Metrics | Week 35, 2026 cbBTC Curve Best Yields & Key Metrics | Week 35, 2026 hemiBTCBTC2.7%
Curve Best Yields & Key Metrics | Week 35, 2026Curve Best Yields & Key Metrics | Week 35, 2026 cbBTC Curve Best Yields & Key Metrics | Week 35, 2026 WBTCBTC2.0%
Curve Best Yields & Key Metrics | Week 35, 2026Curve Best Yields & Key Metrics | Week 35, 2026 cbBTC Curve Best Yields & Key Metrics | Week 35, 2026 WBTC Curve Best Yields & Key Metrics | Week 35, 2026 LBTCBTC1.5%

Other Top Yields

ChainMarketAssetEst. APY
Curve Best Yields & Key Metrics | Week 35, 2026Curve Best Yields & Key Metrics | Week 35, 2026 CRV Curve Best Yields & Key Metrics | Week 35, 2026 sdCRVCRV11.1%
Curve Best Yields & Key Metrics | Week 35, 2026Curve Best Yields & Key Metrics | Week 35, 2026 crvUSD Curve Best Yields & Key Metrics | Week 35, 2026 OP Curve Best Yields & Key Metrics | Week 35, 2026 CRVCRV9.8%
Curve Best Yields & Key Metrics | Week 35, 2026Curve Best Yields & Key Metrics | Week 35, 2026 GHO Curve Best Yields & Key Metrics | Week 35, 2026 cbBTC Curve Best Yields & Key Metrics | Week 35, 2026 WETHTRICRYPTO5.5%
Curve Best Yields & Key Metrics | Week 35, 2026Curve Best Yields & Key Metrics | Week 35, 2026 crvUSD Curve Best Yields & Key Metrics | Week 35, 2026 ZCHFFOREX4.2%
Curve Best Yields & Key Metrics | Week 35, 2026Curve Best Yields & Key Metrics | Week 35, 2026 crvUSD Curve Best Yields & Key Metrics | Week 35, 2026 CJPYFOREX3.5%
Curve Best Yields & Key Metrics | Week 35, 2026Curve Best Yields & Key Metrics | Week 35, 2026 USDC Curve Best Yields & Key Metrics | Week 35, 2026 sUSDatFOREX1.8%
Curve Best Yields & Key Metrics | Week 35, 2026Curve Best Yields & Key Metrics | Week 35, 2026 XAUt Curve Best Yields & Key Metrics | Week 35, 2026 PAXGGOLD0.2%

Protocol health

crvUSD remained close to its target price at $0.9998 while PegKeeper reserves increased to $65 million. Lending and DEX activity also expanded, although the data below does not establish individual-loan health, bad debt or lender withdrawability. Peg, reserves and bad debt are health indicators; TVL, borrowing, swaps and volume are activity indicators, and aggregate collateral growth does not show that individual loans became better covered.

crvUSD & scrvUSD

MetricValueChange
Curve Best Yields & Key Metrics | Week 35, 2026 crvUSD Minted$66.3M+76.0%
Curve Best Yields & Key Metrics | Week 35, 2026 scrvUSD Yield1.3%-0.1%
Curve Best Yields & Key Metrics | Week 35, 2026 crvUSD in Curve Best Yields & Key Metrics | Week 35, 2026 scrvUSD26.1%-18.3%
Curve Best Yields & Key Metrics | Week 35, 2026 crvUSD Price$0.9998-
Curve Best Yields & Key Metrics | Week 35, 2026 Avg. Borrow Rate1.1%-0.9%
Curve Best Yields & Key Metrics | Week 35, 2026 Peg Stability Reserves$65M+$26.5M
Curve Best Yields & Key Metrics | Week 35, 2026 PegKeeper Profit$9.72k+$8.97k
Curve Best Yields & Key Metrics | Week 35, 2026 Fees$12.2k-21.7%

Reserves grew by more than the whole PegKeeper balance stood at two weeks ago.

Llamalend

MetricValueChange
🦙 Llamalend TVL$243M+33.4%
🦙 Supplied$91.9M+3.0%
🦙 Borrowed$131M+32.6%
🦙 Collateral$215M+40.2%
🦙 Loans1124+12
🦙 Fees$1.14k+30.6%

DEX

MetricValueChange
🔄 TVL$1.54B+4.7%
🔄 Volume$1.1B+91.2%
🔄 Swaps618k+25.7%
🔄 Total Fees$347k+24.0%

Volume grew far faster than swap count, so the average trade was about half as large again.

Fees here are DEX pool fees only; crvUSD minting fees and Llamalend fees appear in their own sections.

DAO

MetricValueChange
Curve Best Yields & Key Metrics | Week 35, 2026 CRV Circ. Supply1.55B+0.1%
Curve Best Yields & Key Metrics | Week 35, 2026 CRV Locked851M-
Curve Best Yields & Key Metrics | Week 35, 2026 Total veCRV781M+0.4%
Curve Best Yields & Key Metrics | Week 35, 2026 veCRV Distribution$105k-28.1%
Curve Best Yields & Key Metrics | Week 35, 2026 veCRV APR2.211%-1.499%
Curve Best Yields & Key Metrics | Week 35, 2026 CRV Emissions$592k (1.86M CRV)+8.3%
Curve Best Yields & Key Metrics | Week 35, 2026 Inflation Rate4.029%-0.766%

Governance and protocol updates

More room to borrow against sreUSD

Vote 1475 raised the DAO’s crvUSD credit line to the sreUSD LlamaLend market from $15 million to $30 million.

sreUSD is the yield-bearing version of Resupply’s reUSD stablecoin. Holders can use it as collateral to borrow crvUSD without selling their position—either to access liquidity or to build a leveraged loop with greater exposure to sreUSD yield.

At the publication snapshot, the market had $36.4 million supplied and $23.7 million borrowed, with 65% utilization, a 0.50% variable borrow rate and a 0.33% supply APY.

yRisk selected as risk assessor, funding under vote

Preference vote passed; the binding funding vote is still open. Vote 1478 — a non-binding preference vote — closed and executed on 22 August with 536.9 million CRV in favour and none against. Vote 1492, which funds the mandate closes on 2 September.

yRisk is an automation-first risk provider led by core contributors to Yearn and Resupply. It will monitor LlamaLend v2’s collateral, oracles, liquidity and market parameters, providing alerts and evidence-based recommendations. Their expertise will help LlamaLend v2 scale safely while remaining attractive for borrowers and lenders.

Complete weekly data

The tables below are the reference layer: every market that moved this week, for readers who want to inspect the full set rather than the highlights above.

Top Stableswap Pools

ChainPoolVolumeFees
Curve Best Yields & Key Metrics | Week 35, 2026Curve Best Yields & Key Metrics | Week 35, 2026 USDC Curve Best Yields & Key Metrics | Week 35, 2026 USDT$174.3M$2.1k
Curve Best Yields & Key Metrics | Week 35, 2026Curve Best Yields & Key Metrics | Week 35, 2026 DAI Curve Best Yields & Key Metrics | Week 35, 2026 USDC Curve Best Yields & Key Metrics | Week 35, 2026 USDT$117.5M$17.6k
Curve Best Yields & Key Metrics | Week 35, 2026Curve Best Yields & Key Metrics | Week 35, 2026 USDT Curve Best Yields & Key Metrics | Week 35, 2026 crvUSD$82.9M$8.3k
Curve Best Yields & Key Metrics | Week 35, 2026Curve Best Yields & Key Metrics | Week 35, 2026 USDC Curve Best Yields & Key Metrics | Week 35, 2026 crvUSD$76.9M$7.7k
Curve Best Yields & Key Metrics | Week 35, 2026Curve Best Yields & Key Metrics | Week 35, 2026 PYUSD Curve Best Yields & Key Metrics | Week 35, 2026 USDC$73.2M$7.7k
Curve Best Yields & Key Metrics | Week 35, 2026Curve Best Yields & Key Metrics | Week 35, 2026 USDG Curve Best Yields & Key Metrics | Week 35, 2026 USDC$66.0M$6.9k
Curve Best Yields & Key Metrics | Week 35, 2026Curve Best Yields & Key Metrics | Week 35, 2026 ETH Curve Best Yields & Key Metrics | Week 35, 2026 stETH$52.6M$5.3k
Curve Best Yields & Key Metrics | Week 35, 2026Curve Best Yields & Key Metrics | Week 35, 2026 USDC Curve Best Yields & Key Metrics | Week 35, 2026 RLUSD$44.2M$9.5k
Curve Best Yields & Key Metrics | Week 35, 2026Curve Best Yields & Key Metrics | Week 35, 2026 ETH Curve Best Yields & Key Metrics | Week 35, 2026 stETH$28.4M$2.3k
Curve Best Yields & Key Metrics | Week 35, 2026Curve Best Yields & Key Metrics | Week 35, 2026 reUSD (Re Protocol) Curve Best Yields & Key Metrics | Week 35, 2026 sUSDe$23.8M$2.6k

Top Cryptoswap Pools

ChainPoolVolumeFees
Curve Best Yields & Key Metrics | Week 35, 2026Curve Best Yields & Key Metrics | Week 35, 2026 USDT Curve Best Yields & Key Metrics | Week 35, 2026 WBTC Curve Best Yields & Key Metrics | Week 35, 2026 WETH$22.4M$12.4k
Curve Best Yields & Key Metrics | Week 35, 2026Curve Best Yields & Key Metrics | Week 35, 2026 crvUSD Curve Best Yields & Key Metrics | Week 35, 2026 WETH Curve Best Yields & Key Metrics | Week 35, 2026 CRV$9.4M$8.2k
Curve Best Yields & Key Metrics | Week 35, 2026Curve Best Yields & Key Metrics | Week 35, 2026 USDC Curve Best Yields & Key Metrics | Week 35, 2026 WBTC Curve Best Yields & Key Metrics | Week 35, 2026 WETH$7.6M$4.5k
Curve Best Yields & Key Metrics | Week 35, 2026Curve Best Yields & Key Metrics | Week 35, 2026 crvUSD Curve Best Yields & Key Metrics | Week 35, 2026 tBTC Curve Best Yields & Key Metrics | Week 35, 2026 wstETH$4.0M$6.8k
Curve Best Yields & Key Metrics | Week 35, 2026Curve Best Yields & Key Metrics | Week 35, 2026 WETH Curve Best Yields & Key Metrics | Week 35, 2026 CVX$3.6M$14.5k
Curve Best Yields & Key Metrics | Week 35, 2026Curve Best Yields & Key Metrics | Week 35, 2026 crvUSD Curve Best Yields & Key Metrics | Week 35, 2026 YB$2.5M$8.4k

Gauge Winners & Losers

ChainPool / MarketCRV EmissionsChange
Curve Best Yields & Key Metrics | Week 35, 2026Curve Best Yields & Key Metrics | Week 35, 2026 OETH Curve Best Yields & Key Metrics | Week 35, 2026 WETH76.8k+3.49k
Curve Best Yields & Key Metrics | Week 35, 2026Curve Best Yields & Key Metrics | Week 35, 2026 USDT Curve Best Yields & Key Metrics | Week 35, 2026 USDe4.03k+1.87k
Curve Best Yields & Key Metrics | Week 35, 2026Curve Best Yields & Key Metrics | Week 35, 2026 CRV Curve Best Yields & Key Metrics | Week 35, 2026 sdCRV15.9k+1.61k
............
Curve Best Yields & Key Metrics | Week 35, 2026Curve Best Yields & Key Metrics | Week 35, 2026 frxUSD Curve Best Yields & Key Metrics | Week 35, 2026 msUSD36k-1.71k
Curve Best Yields & Key Metrics | Week 35, 2026Curve Best Yields & Key Metrics | Week 35, 2026 crvUSD Curve Best Yields & Key Metrics | Week 35, 2026 sDOLA24.3k-1.83k
Curve Best Yields & Key Metrics | Week 35, 2026Curve Best Yields & Key Metrics | Week 35, 2026 msUSD Curve Best Yields & Key Metrics | Week 35, 2026 FRAX Curve Best Yields & Key Metrics | Week 35, 2026 USDC5.04k-3.52k

OETH/WETH took the largest weight gain of the week; the three msUSD pools gave up the most.

DEX Winners & Losers

Fees Winners & Losers

ChainPoolFeesChange
Curve Best Yields & Key Metrics | Week 35, 2026Curve Best Yields & Key Metrics | Week 35, 2026 WETH Curve Best Yields & Key Metrics | Week 35, 2026 CVX$14.5k+$9.21k
Curve Best Yields & Key Metrics | Week 35, 2026Curve Best Yields & Key Metrics | Week 35, 2026 USDT Curve Best Yields & Key Metrics | Week 35, 2026 WBTC Curve Best Yields & Key Metrics | Week 35, 2026 WETH$12.4k+$8.03k
Curve Best Yields & Key Metrics | Week 35, 2026Curve Best Yields & Key Metrics | Week 35, 2026 DAI Curve Best Yields & Key Metrics | Week 35, 2026 USDC Curve Best Yields & Key Metrics | Week 35, 2026 USDT$17.6k+$7.66k
............
Curve Best Yields & Key Metrics | Week 35, 2026Curve Best Yields & Key Metrics | Week 35, 2026 frxUSD Curve Best Yields & Key Metrics | Week 35, 2026 KRWQ$21.8-$1.28k
Curve Best Yields & Key Metrics | Week 35, 2026Curve Best Yields & Key Metrics | Week 35, 2026 USDC Curve Best Yields & Key Metrics | Week 35, 2026 fxUSD$1.39k-$1.71k
Curve Best Yields & Key Metrics | Week 35, 2026Curve Best Yields & Key Metrics | Week 35, 2026 apxUSD Curve Best Yields & Key Metrics | Week 35, 2026 USDC$8.25k-$6.21k

Volume Winners & Losers

ChainPoolVolumeChange
Curve Best Yields & Key Metrics | Week 35, 2026Curve Best Yields & Key Metrics | Week 35, 2026 USDC Curve Best Yields & Key Metrics | Week 35, 2026 USDT$174M+$143M
Curve Best Yields & Key Metrics | Week 35, 2026Curve Best Yields & Key Metrics | Week 35, 2026 DAI Curve Best Yields & Key Metrics | Week 35, 2026 USDC Curve Best Yields & Key Metrics | Week 35, 2026 USDT$117M+$51M
Curve Best Yields & Key Metrics | Week 35, 2026Curve Best Yields & Key Metrics | Week 35, 2026 USDC Curve Best Yields & Key Metrics | Week 35, 2026 crvUSD$76.9M+$48.3M
............
Curve Best Yields & Key Metrics | Week 35, 2026Curve Best Yields & Key Metrics | Week 35, 2026 USDC Curve Best Yields & Key Metrics | Week 35, 2026 USDat$10.9M-$6.71M
Curve Best Yields & Key Metrics | Week 35, 2026Curve Best Yields & Key Metrics | Week 35, 2026 USDnr Curve Best Yields & Key Metrics | Week 35, 2026 fxUSD$723k-$9.86M
Curve Best Yields & Key Metrics | Week 35, 2026Curve Best Yields & Key Metrics | Week 35, 2026 USDC Curve Best Yields & Key Metrics | Week 35, 2026 fxUSD$13.4M-$16.7M

TVL Winners & Losers

ChainPoolTVLChange
Curve Best Yields & Key Metrics | Week 35, 2026Curve Best Yields & Key Metrics | Week 35, 2026 USDT Curve Best Yields & Key Metrics | Week 35, 2026 crvUSD$77.2M+$29.6M
Curve Best Yields & Key Metrics | Week 35, 2026Curve Best Yields & Key Metrics | Week 35, 2026 crvUSD Curve Best Yields & Key Metrics | Week 35, 2026 WETH$68.1M+$22.8M
Curve Best Yields & Key Metrics | Week 35, 2026Curve Best Yields & Key Metrics | Week 35, 2026 ETH Curve Best Yields & Key Metrics | Week 35, 2026 stETH$102M+$9.9M
............
Curve Best Yields & Key Metrics | Week 35, 2026Curve Best Yields & Key Metrics | Week 35, 2026 USDC Curve Best Yields & Key Metrics | Week 35, 2026 crvUSD$12.1M-$2.48M
Curve Best Yields & Key Metrics | Week 35, 2026Curve Best Yields & Key Metrics | Week 35, 2026 USDC Curve Best Yields & Key Metrics | Week 35, 2026 RLUSD$56M-$4.8M
Curve Best Yields & Key Metrics | Week 35, 2026Curve Best Yields & Key Metrics | Week 35, 2026 crvUSD Curve Best Yields & Key Metrics | Week 35, 2026 WETH$1.08M-$19.1M

The two crvUSD/WETH lines are different pools: one took in $22.8M, the other gave back $19.1M.

Llamalend Winners & Losers

crvUSD Minting Markets - Borrowing Winners & Losers

ChainMarketBorrowedChange
Curve Best Yields & Key Metrics | Week 35, 2026Curve Best Yields & Key Metrics | Week 35, 2026 crvUSD Curve Best Yields & Key Metrics | Week 35, 2026 wstETH$32M+$22.2M
Curve Best Yields & Key Metrics | Week 35, 2026Curve Best Yields & Key Metrics | Week 35, 2026 crvUSD Curve Best Yields & Key Metrics | Week 35, 2026 WBTC$20.9M+$5.31M
Curve Best Yields & Key Metrics | Week 35, 2026Curve Best Yields & Key Metrics | Week 35, 2026 crvUSD Curve Best Yields & Key Metrics | Week 35, 2026 WETH$2.43M+$704k
............
Curve Best Yields & Key Metrics | Week 35, 2026Curve Best Yields & Key Metrics | Week 35, 2026 crvUSD Curve Best Yields & Key Metrics | Week 35, 2026 weETH$230k+$75k
Curve Best Yields & Key Metrics | Week 35, 2026Curve Best Yields & Key Metrics | Week 35, 2026 crvUSD Curve Best Yields & Key Metrics | Week 35, 2026 sfrxETH$154k-$41.6
Curve Best Yields & Key Metrics | Week 35, 2026Curve Best Yields & Key Metrics | Week 35, 2026 crvUSD Curve Best Yields & Key Metrics | Week 35, 2026 tBTC$5.5M-$113k

wstETH alone accounts for most of the week's growth in crvUSD debt.

Lend Markets - Borrowing Winners & Losers

ChainMarketBorrowedChange
Curve Best Yields & Key Metrics | Week 35, 2026Curve Best Yields & Key Metrics | Week 35, 2026 crvUSD Curve Best Yields & Key Metrics | Week 35, 2026 sUSDe$4.92M+$1.83M
Curve Best Yields & Key Metrics | Week 35, 2026Curve Best Yields & Key Metrics | Week 35, 2026 crvUSD Curve Best Yields & Key Metrics | Week 35, 2026 sDOLA$5.74M+$1.55M
Curve Best Yields & Key Metrics | Week 35, 2026Curve Best Yields & Key Metrics | Week 35, 2026 crvUSD Curve Best Yields & Key Metrics | Week 35, 2026 sfrxUSD$10.7M+$1.51M
............
Curve Best Yields & Key Metrics | Week 35, 2026Curve Best Yields & Key Metrics | Week 35, 2026 crvUSD Curve Best Yields & Key Metrics | Week 35, 2026 WBTC$3.21M-$95.1k
Curve Best Yields & Key Metrics | Week 35, 2026Curve Best Yields & Key Metrics | Week 35, 2026 crvUSD Curve Best Yields & Key Metrics | Week 35, 2026 sreUSD$23.7M-$631k
Curve Best Yields & Key Metrics | Week 35, 2026Curve Best Yields & Key Metrics | Week 35, 2026 crvUSD Curve Best Yields & Key Metrics | Week 35, 2026 sfrxUSD$6.43M-$1.33M

sfrxUSD sits on both sides again: one market borrowed $1.51M more, another repaid $1.33M.

Lend Markets - Supplying Winners & Losers

ChainMarketSuppliedChange
Curve Best Yields & Key Metrics | Week 35, 2026Curve Best Yields & Key Metrics | Week 35, 2026 crvUSD Curve Best Yields & Key Metrics | Week 35, 2026 sfrxUSD$13M+$1.7M
Curve Best Yields & Key Metrics | Week 35, 2026Curve Best Yields & Key Metrics | Week 35, 2026 crvUSD Curve Best Yields & Key Metrics | Week 35, 2026 sDOLA$8.75M+$919k
Curve Best Yields & Key Metrics | Week 35, 2026Curve Best Yields & Key Metrics | Week 35, 2026 crvUSD Curve Best Yields & Key Metrics | Week 35, 2026 sUSDe$6.62M+$749k
............
Curve Best Yields & Key Metrics | Week 35, 2026Curve Best Yields & Key Metrics | Week 35, 2026 crvUSD Curve Best Yields & Key Metrics | Week 35, 2026 tBTC$48.8k-$78.2k
Curve Best Yields & Key Metrics | Week 35, 2026Curve Best Yields & Key Metrics | Week 35, 2026 crvUSD Curve Best Yields & Key Metrics | Week 35, 2026 sfrxUSD$8.11M-$877k
Curve Best Yields & Key Metrics | Week 35, 2026Curve Best Yields & Key Metrics | Week 35, 2026 crvUSD Curve Best Yields & Key Metrics | Week 35, 2026 syrupUSDC$3.04M-$932k

Explore Curve

Know someone tracking DeFi yields? Forward them this issue. Subscribe on Curve News to receive next week’s report.

Risk information: pool risks, lending risks and crvUSD risks.

Comments
anonymous profile image
Powered by RoundtableBuilt on infrastructure designed for real-time media. Learn more at RTB.io.© Roundtable 2026. By using this site you agree to the Terms of Use and Privacy Policy