


Sep 3, 2026 7:48 PM
Updated Sep 4, 2026 9:18 AM
Weekly yield and Curve ecosystem metric updates as of the 3rd September, 2026
This article was originally published by 0xtutti on Curve News.Curve this week in 60 seconds
- Top pool APYs: sUSG/reUSD at 23.6%, OUSD/USG at 18.8%, and reUSD/sDOLA at 15.3%.
- Yield quality: leading rates are mostly incentive-driven. sUSG/reUSD has the largest fee contribution, with 9.2 percentage points coming from trading fees.
- Lending: the highest listed supply rates are 7.0% for crvUSD/svZCHF and 5.1% for crvUSD/sDOLA.
- Protocol: crvUSD held its peg at $0.9997 with $72.8 million minted, while PegKeeper reserves fell to $42.2 million.
- Governance: the yRisk mandate is now funded, and a second vote on YieldBasis BTC pool fees is open.
This week's takeaway: crvUSD minting expanded while PegKeeper reserves declined, but crvUSD remained close to peg at $0.9997. Whether reserves rebuild as minting continues is the stability metric to watch next week.
Top yields
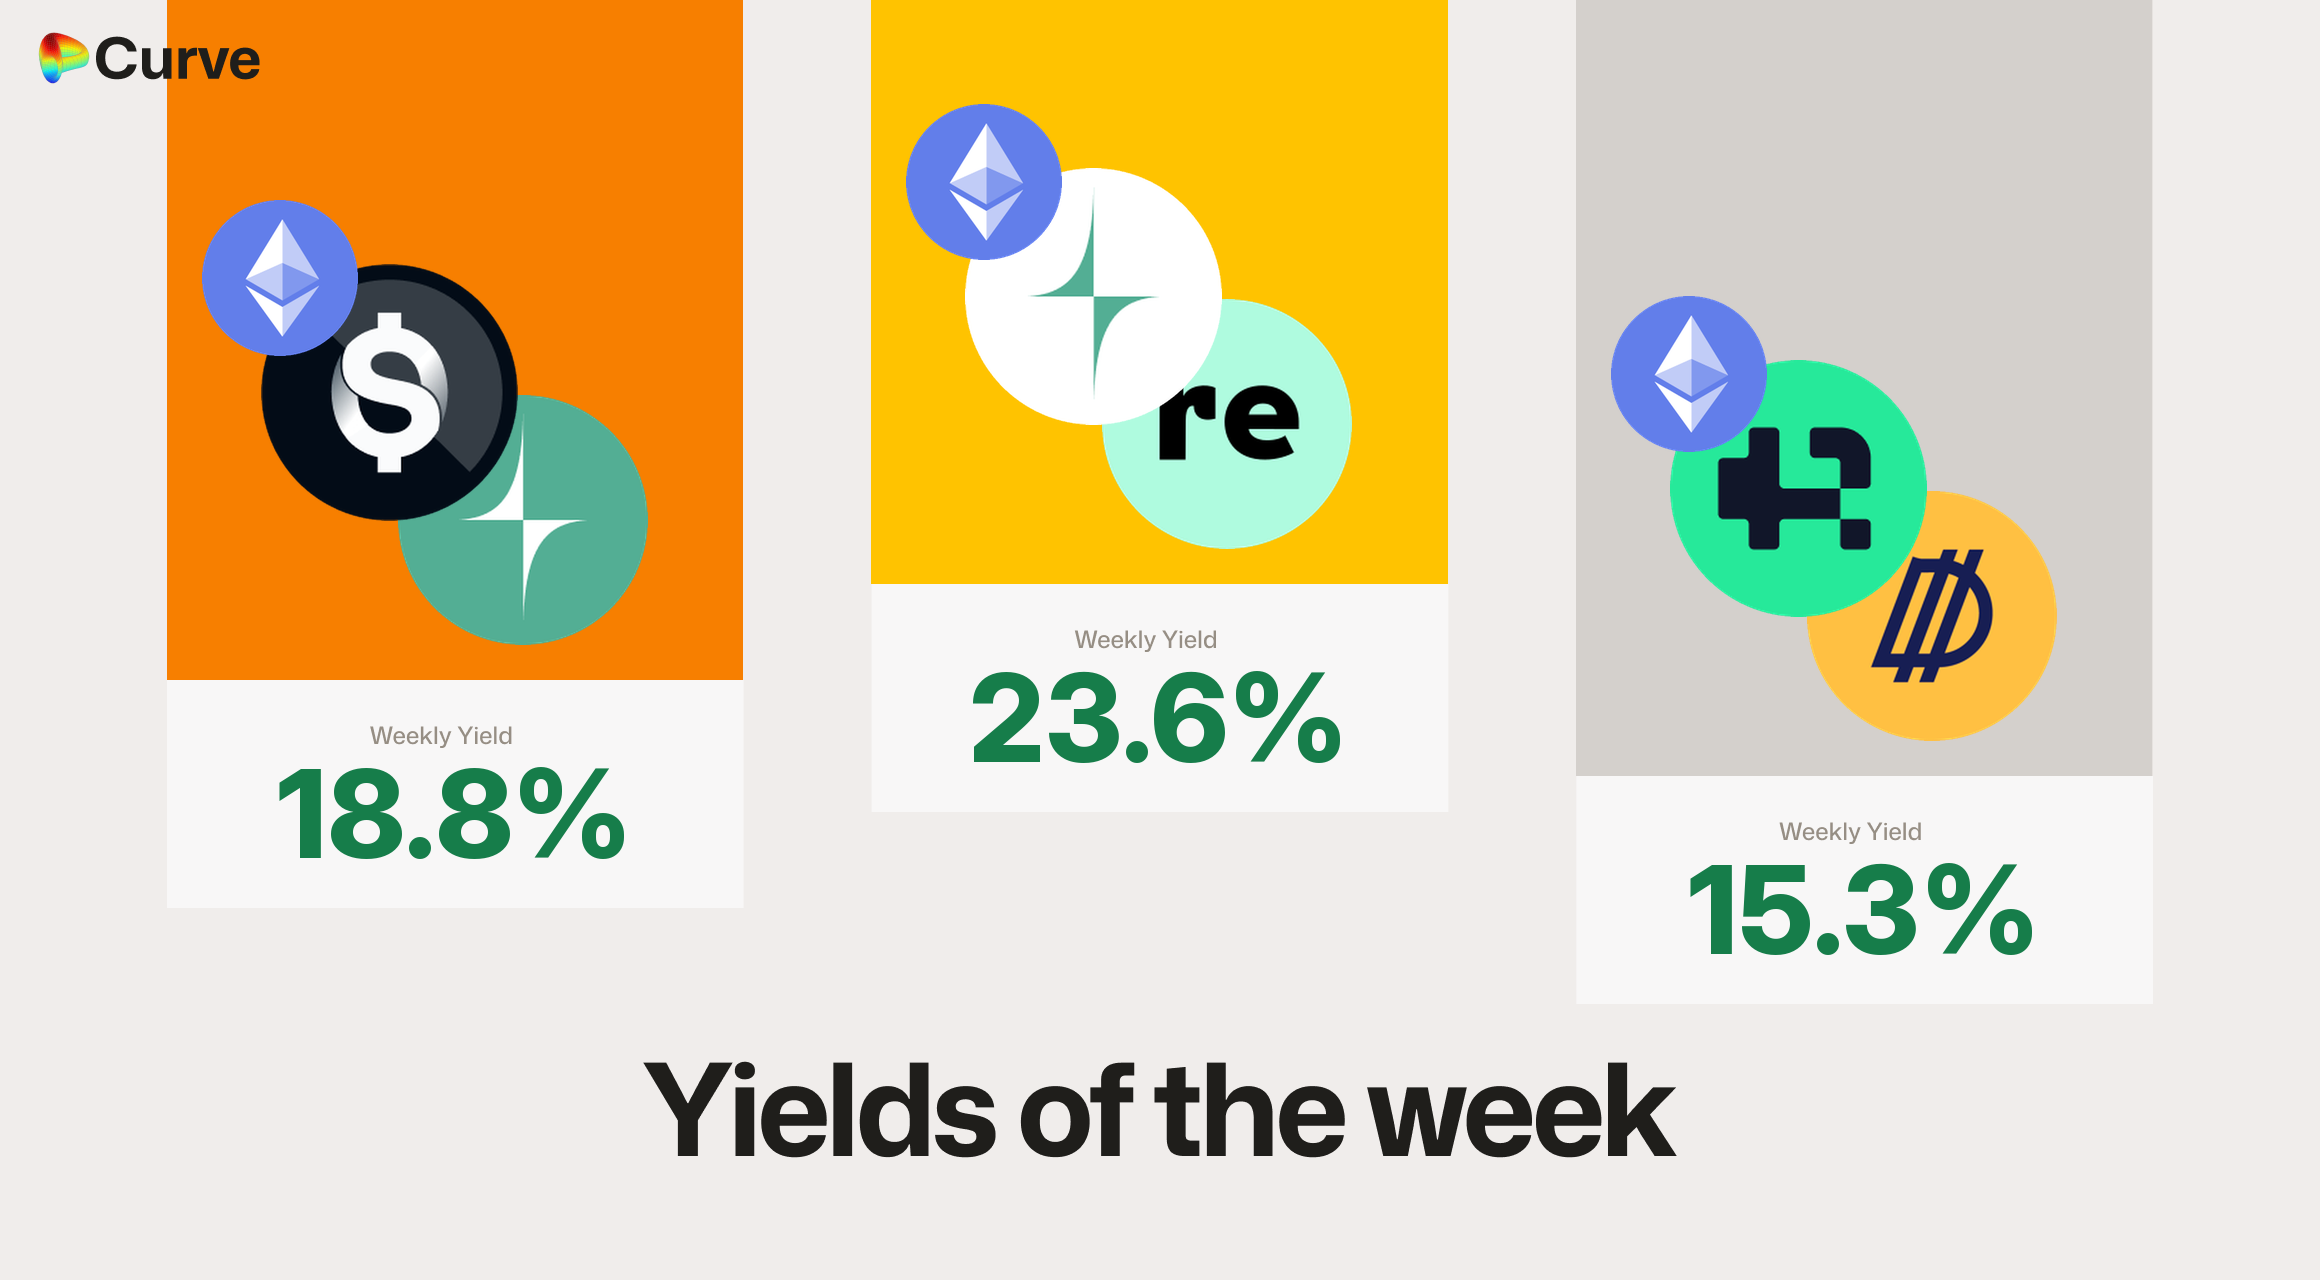 Curve Best Yields & Key Metrics | Week 36, 2026
Rates are estimated annualized returns for a modeled $100,000 deposit after pool dilution. They include base fees, unboosted CRV and active Merkl rewards where applicable. Rates are variable and not guaranteed.
Top USD yields
| Chain | Market | Type | Est. APY |
|---|---|---|---|
 |  sUSG  reUSD (Re Protocol) | Pool | 23.6% |
|  OUSD  USG | Pool | 18.8% |
|  reUSD (Resupply USD)  sDOLA | Pool | 15.3% |
 |  frxUSD  FXB20551231 | Pool | 10.6% |
| reUSD (Resupply USD)  scrvUSD | Pool | 10.2% |
|  evaUSDT  evaUSDC | Pool | 9.7% |
| USG sDOLA | Pool | 9.7% |
|  USDC USG | Pool | 9.4% |
| reUSD (Resupply USD)  sfrxUSD | Pool | 9.4% |
|  USDT  USDe | Pool | 8.5% |
What supports the leading rates: the leading USD pool yields are mostly incentive-driven, so they can fall when rewards change. sUSG/reUSD has the largest fee contribution, with 9.2 percentage points coming from trading fees. Several leading pools also have relatively low TVL, making their returns more sensitive to new deposits and changes in incentives: $0.23 million for OUSD/USG, $1.04 million for sUSG/reUSD and $3.22 million for reUSD/sDOLA, against $11.68 million for reUSD/scrvUSD.
Top LlamaLend supply yields
| Chain | Market | Supply APY |
|---|---|---|
|  crvUSD  svZCHF | 7.0% |
| crvUSD sDOLA | 5.1% |
| crvUSD sfrxUSD | 4.8% |
| crvUSD  sUSDe | 4.8% |
 |  USDC  wstETH | 4.7% |
| USDC  WBTC | 4.5% |
 |  crvUSD  WETH | 4.3% |
| crvUSD  syrupUSDC | 4.3% |
| crvUSD  fxSAVE | 4.1% |
| crvUSD  wstETH | 4.0% |
Top BTC and ETH yields
| Chain | Market | Asset | Est. APY |
|---|---|---|---|
|  ETH  ETHx | ETH | 5.1% |
|  frxETH  sfrxETH | ETH | 2.9% |
|  WBTC  cbBTC  hemiBTC | BTC | 2.5% |
| cbBTC WBTC | BTC | 2.4% |
|  osETH  rETH | ETH | 2.3% |
 |  cbBTC  WBTC  LBTC | BTC | 1.5% |
Other top yields
| Chain | Market | Asset | Est. APY |
|---|---|---|---|
|  CRV  cvxCRV | CRV | 12.1% |
| CRV  sdCRV | CRV | 10.9% |
|  GHO cbBTC  WETH | TRICRYPTO | 5.0% |
| crvUSD  ZCHF | FOREX | 4.7% |
| crvUSD  CJPY | FOREX | 3.0% |
 |  EURe (Monerium EUR)  WXDAI  USDC  USDT | FOREX | 2.7% |
|  XAUt  PAXG | GOLD | 0.1% |
Protocol activity and stability
crvUSD remained close to peg at $0.9997. Minting rose 9.8% and LlamaLend borrowing increased 4.8%, while PegKeeper reserves fell by $22.8 million to $42.2 million. DEX TVL, volume, swaps and fees also declined, but these measure activity rather than protocol solvency.
crvUSD & scrvUSD
| Metric | Value | Change |
|---|---|---|
| crvUSD Minted | $72.8M | +9.8% |
 scrvUSD Yield | 0.8% | -0.4% |
| crvUSD in scrvUSD | 21.7% | -4.4% |
| crvUSD Price | $0.9997 | -$0.0001 |
| Avg. Borrow Rate | 1.8% | +0.7% |
| Peg Stability Reserves | $42.2M | -$22.8M |
| PegKeeper Profit | $4.59k | -$5.13k |
| Fees | $19.7k | +62.2% |
LlamaLend
| Metric | Value | Change |
|---|---|---|
| 🦙 Llamalend TVL | $251M | +3.2% |
| 🦙 Supplied | $92M | +0.1% |
| 🦙 Borrowed | $138M | +4.8% |
| 🦙 Collateral | $223M | +3.4% |
| 🦙 Loans | 1140 | +16 |
| 🦙 Fees | $1.42k | +24.7% |
DEX
| Metric | Value | Change |
|---|---|---|
| 🔄 TVL | $1.48B | -3.9% |
| 🔄 Volume | $790M | -28.4% |
| 🔄 Swaps | 379k | -38.7% |
| 🔄 Total Fees | $183k | -47.2% |
Fees here are DEX pool fees only; crvUSD minting fees and LlamaLend fees appear in their own sections.
DAO
| Metric | Value | Change |
|---|---|---|
| CRV Circ. Supply | 1.55B | +0.1% |
| CRV Locked | 850M | - |
 Total veCRV | 780M | -0.1% |
| veCRV Distribution | $94.7k | -10.0% |
| veCRV APR | 1.744% | -0.467% |
| CRV Emissions | $610k (1.86M CRV) | -13.3% |
| Inflation Rate | 4.026% | -0.765% |
Governance and protocol updates
The yRisk risk mandate is now active and funded
Vote 1492 executed on 2 September, activating and funding yRisk’s one-year risk-assessment mandate for LlamaLend.
Led by contributors to Yearn and Resupply, yRisk will monitor collateral, oracles, liquidity and market parameters, providing alerts and recommendations as conditions change. The mandate is revocable by the DAO.
It is paid as two revocable one-year vesting streams to yrisk.eth — 125,000 frxUSD held as sfrxUSD, and 568,181 CRV — with the sfrxUSD yield returning to the Curve treasury.
YieldBasis BTC fees: one update executed, another open
Vote 1491 executed on 29 August, changing how the swap fee behaves on the yb-cbBTC and yb-tBTC pools: cheaper when the pool is balanced, considerably more expensive when it is not, and reaching that higher level sooner. Vote 1494, submitted on 31 August, is still open; it would replace that behaviour with a single flat fee of 1.30% across the YieldBasis wBTC, cbBTC and tBTC pools, and change how often each pool rebalances.
The swap fee is what a trader pays and what liquidity providers earn. In these pools it is not one number: it sits low while the pool is balanced and rises as the pool drifts, which pays providers more for the trades that unbalance them. After the August change a balanced trade costs less than before and an unbalancing one costs much more. The open vote would drop that mechanism entirely and charge one flat rate whatever the pool state, making the cost of a trade predictable and removing the extra reward for trades that restore balance.
Measured on chain for both pools: the balanced-pool fee went from 1.46% to 1.28%, the out-of-balance fee from 1.70% to 3.28%, and the fee now climbs toward that ceiling roughly twice as quickly. The open vote proposes a flat 1.30%.
A slower price average for two sDOLA pools
Vote 1493 executed on 2 September, lengthening the price-averaging window on the scrvUSD/sDOLA and sDOLA/invUSD pools from about 14 minutes to one hour.
A Curve pool does not price its assets off the last trade alone; it uses a time-weighted average, so a single large trade cannot move the quoted price on its own. A longer window makes that average react more slowly — steadier pricing in a thin market, at the cost of lagging a genuine move for longer.
Measured on chain: ma_exp_time went from 866 seconds to 3,600 on both pools.
Two gauges added, for two different purposes
The frxUSD/sUSDai gauge is the ordinary kind: it lets a pool compete for the weekly CRV emissions that veCRV holders vote on, so depositors there can now earn CRV. The veFunder gauge is not a pool at all — it is the DAO’s funding route, where veCRV holders can direct emissions toward Vyper development instead of toward liquidity.
Reference tables and largest weekly changes
The following tables provide additional market data for readers who want to go beyond this week’s highlights.
Top stableswap pools
| Chain | Pool | Volume | Fees |
|---|---|---|---|
| USDC USDT | $152.5M | $1.7k |
|  USDG USDC | $109.7M | $12.3k |
|  DAI USDC USDT | $93.7M | $14.1k |
| USDC  USDat | $50.2M | $5.3k |
| USDT USDe | $38.1M | $1.3k |
| USDT crvUSD | $34.0M | $3.4k |
| USDC  RLUSD | $30.6M | $6.6k |
|  PYUSD USDC | $29.9M | $3.3k |
| USDC crvUSD | $20.5M | $2.0k |
| USDC  fxUSD | $17.9M | $1.9k |
Top cryptoswap pools
| Chain | Pool | Volume | Fees |
|---|---|---|---|
| USDT WBTC WETH | $12.8M | $6.2k |
| crvUSD WETH CRV | $7.3M | $4.7k |
| USDC WBTC WETH | $5.3M | $2.6k |
| USDT WBTC WETH | $2.9M | $11.9k |
| WETH  CVX | $2.5M | $9.4k |
| EURe (Monerium EUR) WXDAI USDC USDT | $1.9M | $642.5 |
Largest gauge weight changes
| Chain | Pool / Market | CRV Emissions | Change |
|---|---|---|---|
| reUSD (Resupply USD) scrvUSD | 136k | +30.6k |
| CRV cvxCRV | 113k | +27.9k |
| reUSD (Resupply USD) sDOLA | 39.8k | +23.8k |
| ... | ... | ... | ... |
|  frxUSD USG | 17k | -23.4k |
|  DOLA sUSDe | 138k | -25.4k |
|  OETH WETH | 43.4k | -33.4k |
reUSD/scrvUSD took the largest weight gain of the week. OETH/WETH, which took the largest gain last week, gave up the most this week.
DEX markets
Largest fee changes
| Chain | Pool | Fees | Change |
|---|---|---|---|
| USDG USDC | $12.3k | +$5.43k |
| USDC USDat | $5.28k | +$4.18k |
| WETH  T | $3.36k | +$3.02k |
| ... | ... | ... | ... |
| WETH CVX | $9.35k | -$5.19k |
| USDC crvUSD | $2.05k | -$5.64k |
| USDT WBTC WETH | $6.19k | -$6.17k |
Largest volume changes
| Chain | Pool | Volume | Change |
|---|---|---|---|
| USDG USDC | $110M | +$43.7M |
| USDC USDat | $50.2M | +$39.3M |
| USDT USDe | $38.1M | +$20.3M |
| ... | ... | ... | ... |
| ETH  stETH | $7.46M | -$45.2M |
| USDT crvUSD | $34M | -$48.8M |
| USDC crvUSD | $20.5M | -$56.4M |
Largest TVL changes
| Chain | Pool | TVL | Change |
|---|---|---|---|
| USDC RLUSD | $65.7M | +$9.71M |
| USDC crvUSD | $13.7M | +$1.58M |
| frxUSD crvUSD | $14.8M | +$1.42M |
| ... | ... | ... | ... |
| crvUSD WETH | $59.7M | -$8.42M |
| USDG USDC | $20M | -$10.5M |
| USDT crvUSD | $54.3M | -$22.8M |
LlamaLend markets
Largest changes in crvUSD borrowing
| Chain | Market | Borrowed | Change |
|---|---|---|---|
| crvUSD WBTC | $24.5M | +$3.61M |
| crvUSD cbBTC | $5.15M | +$1.51M |
| crvUSD wstETH | $33.1M | +$1.08M |
| ... | ... | ... | ... |
| crvUSD  tBTC | $5.52M | +$24.1k |
| crvUSD  weETH | $230k | +$281 |
| crvUSD  sfrxETH | $154k | +$6.06 |
The week’s growth in crvUSD debt came mostly from BTC collateral: WBTC added $3.61 million and cbBTC $1.51 million, against $1.08 million for wstETH.
Largest changes in LlamaLend borrowing
| Chain | Market | Borrowed | Change |
|---|---|---|---|
| crvUSD sfrxUSD | $11.7M | +$998k |
| crvUSD sDOLA | $6.18M | +$434k |
| crvUSD sUSDe | $5.34M | +$421k |
| ... | ... | ... | ... |
|  WETH wstETH | $206k | -$319k |
| crvUSD WBTC | $2.85M | -$366k |
| crvUSD sfrxUSD | $5.49M | -$938k |
crvUSD/sfrxUSD appears on both sides because these are two separate markets with the same collateral: the LlamaLend v2 market (controller 0x3cD4…1bbe, $11.7 million borrowed) took on $998k more debt, while the older v1 market (controller 0x3DE3…BF50, $5.49 million borrowed) was paid down by $938k.
Largest changes in LlamaLend supply
| Chain | Market | Supplied | Change |
|---|---|---|---|
| crvUSD sfrxUSD | $14.4M | +$1.35M |
| crvUSD sDOLA | $9.51M | +$763k |
| crvUSD sUSDe | $7.29M | +$679k |
| ... | ... | ... | ... |
| crvUSD WBTC | $3.67M | -$390k |
| crvUSD  sreUSD | $35.6M | -$800k |
| crvUSD sfrxUSD | $7.24M | -$871k |
Explore Curve
Know someone tracking DeFi yields? Forward them this issue. Subscribe on Curve News to receive next week’s report.
Risk information: pool risks, lending risks and crvUSD risks.
Comments

Powered by RoundtableBuilt on infrastructure designed for real-time media. Learn more at RTB.io.© Roundtable 2026. By using this site you agree to the Terms of Use and Privacy Policy