


Sep 10, 2026 8:08 PM
Updated Sep 11, 2026 9:18 AM
Weekly yield and Curve ecosystem metric updates as of the 10th September, 2026
This article was originally published by Curve on Curve News.Curve this week in 60 seconds
- Top pool APYs: sUSG/reUSD at 21.5%, OUSD/USG at 18.1%, and MUSD/USDC/USDT at 17.9%.
- Yield quality: the leading rates are mostly incentive-driven. Trading fees supply 8.5 of sUSG/reUSD’s 21.5 percentage points, the most of the top three; further down the table sUSDx/USDx at 11.0% is the one pool paid by fees alone.
- Lending: the highest listed supply rates are 7.9% for crvUSD/CRV and 6.5% for crvUSD/svZCHF.
- Protocol: crvUSD held its peg at $0.9996 with $75.8 million minted, while PegKeeper reserves fell to $15.8 million.
- Governance: the YieldBasis BTC fee change is finished — all three pools now charge one flat rate.
This week's takeaway: PegKeeper reserves fell for a second week and now sit in a single PegKeeper, while crvUSD stayed at $0.9996 and minting kept growing. That measure moves in wide swings — it was at zero on 2 July and back to $33.8 million a week later.
Top yields
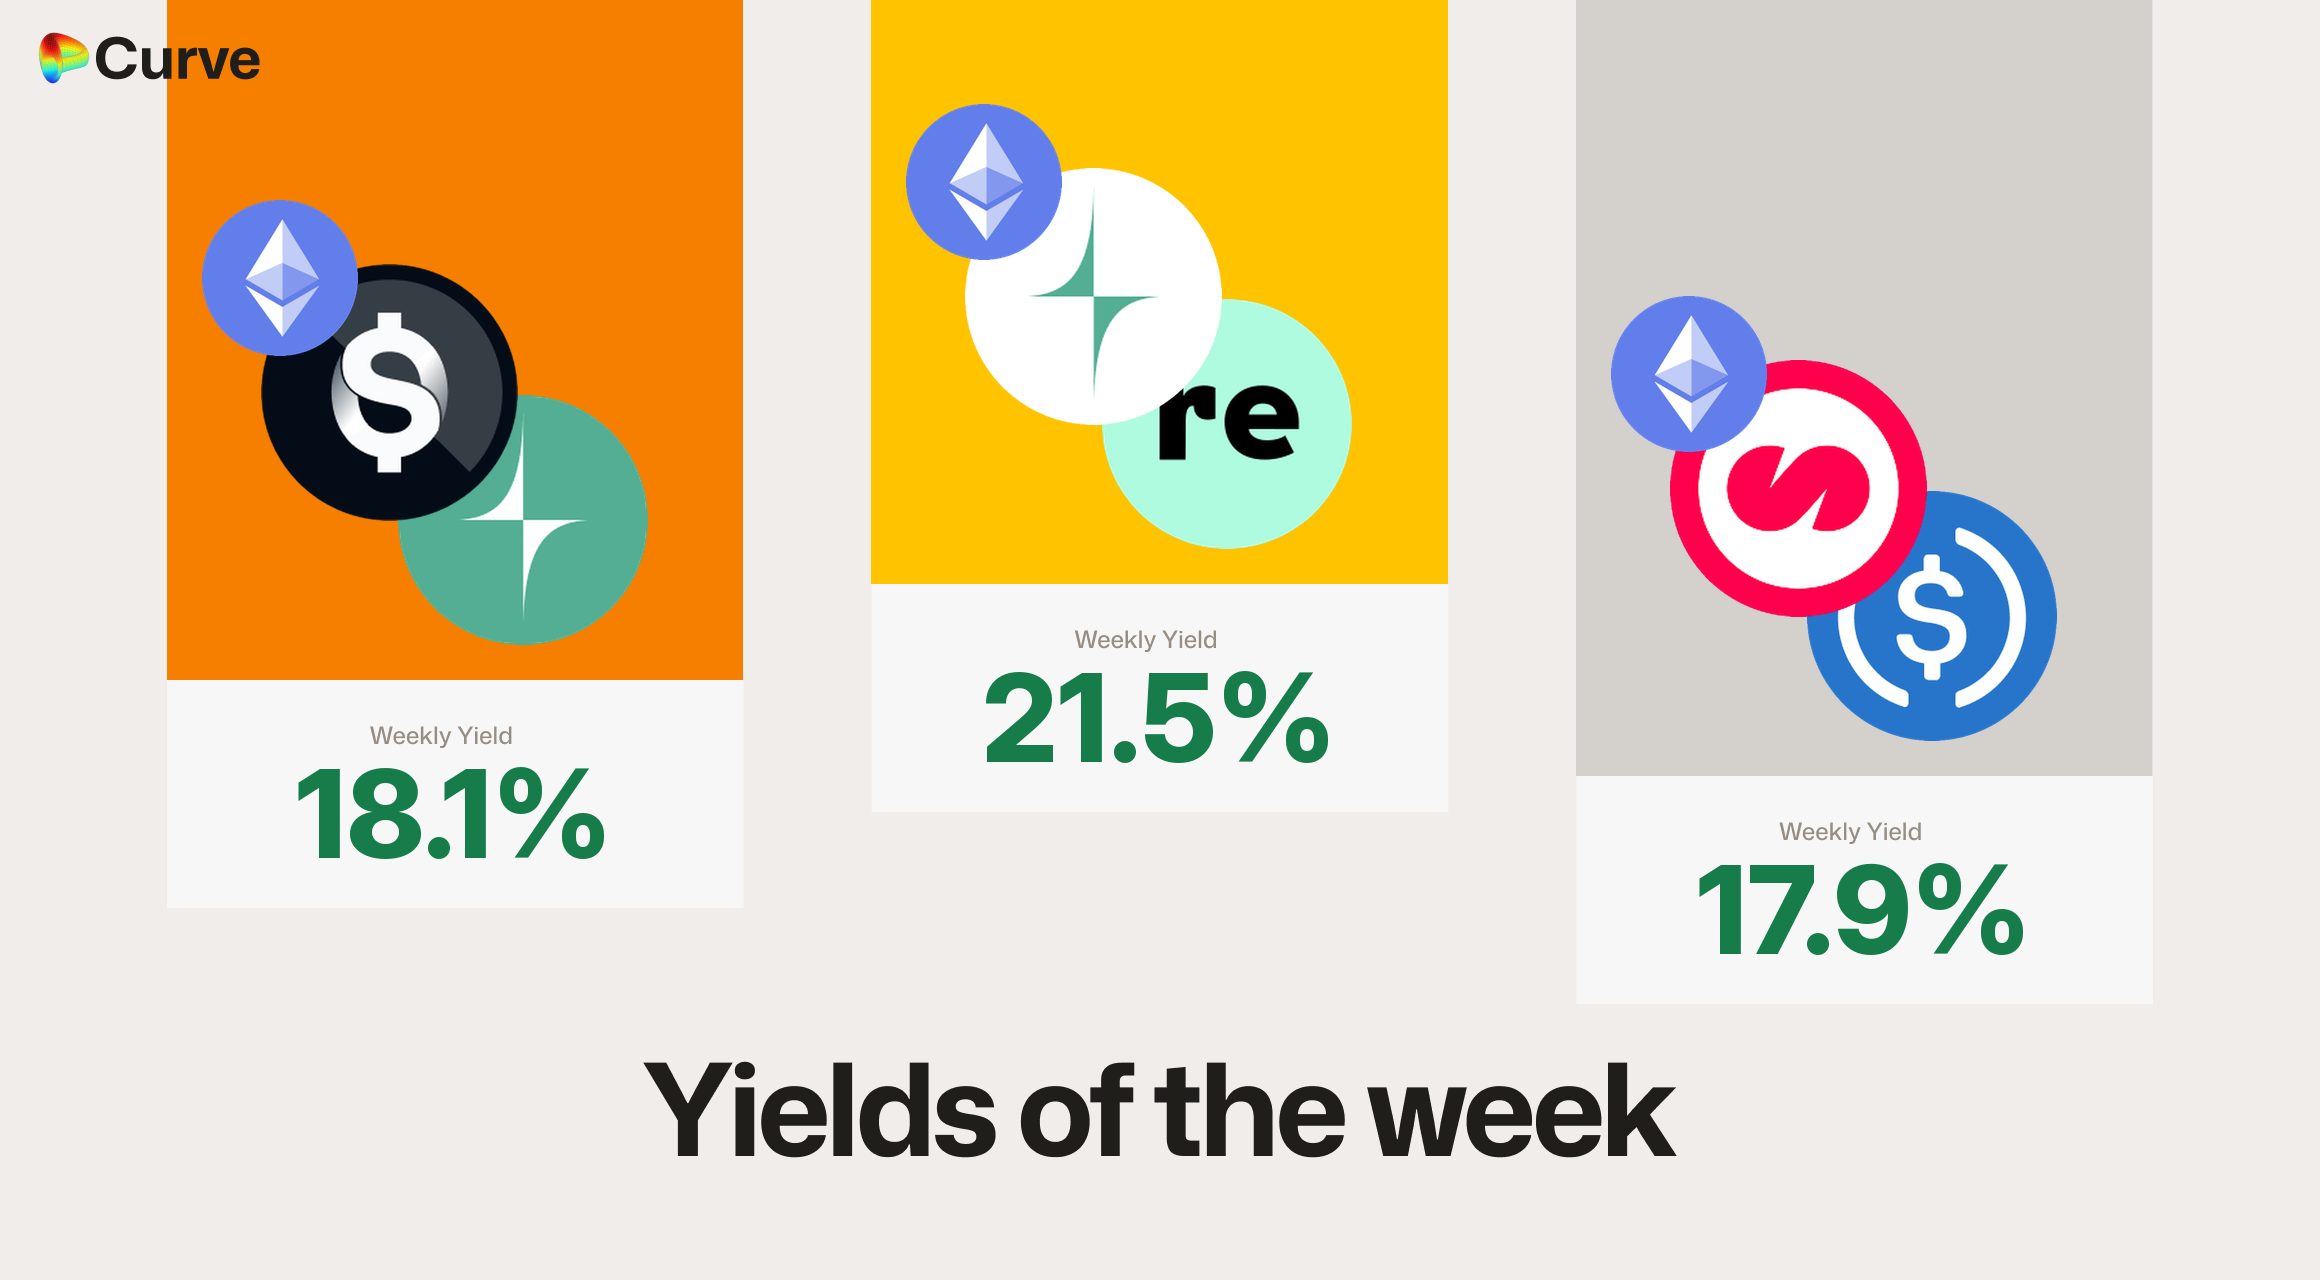 Curve Best Yields & Key Metrics | Week 37, 2026
Rates are estimated annualized returns after modeling how a $100,000 deposit would affect each pool. They include trading fees, CRV at the unboosted rate and active Merkl rewards where applicable. Rates are variable and not guaranteed.
Top USD yields
| Chain | Market | Type | Est. APY |
|---|---|---|---|
 |  sUSG  reUSD (Re Protocol) | Pool | 21.5% |
|  OUSD  USG | Pool | 18.1% |
|  MUSD  USDC  USDT | Pool | 17.9% |
|  frxUSD  sUSDai | Pool | 11.6% |
|  sUSDx  USDx | Pool | 11.0% |
|  reUSD (Resupply USD)  sDOLA | Pool | 10.2% |
 |  frxUSD  FXB20551231 | Pool | 9.7% |
| reUSD (Resupply USD)  sfrxUSD | Pool | 8.8% |
| USG sDOLA | Pool | 8.5% |
| reUSD (Resupply USD)  scrvUSD | Pool | 8.2% |
Two unrelated assets in this table share the reUSD ticker: Re Protocol’s reUSD and Resupply USD.
What supports the leading rates: the leading USD pool yields are mostly incentive-driven, so they can fall when rewards change. Trading fees supply 8.5 of sUSG/reUSD’s 21.5 percentage points, the most of the three; for OUSD/USG and MUSD/USDC/USDT the fee share is under half a percentage point, and the MUSD/USDC/USDT rate rests on a live Merkl campaign that ends on its own schedule. MUSD here is Mezo USD. Several leading pools also have relatively low TVL, making their returns more sensitive to new deposits and changes in incentives: $0.21 million for OUSD/USG, $0.65 million for MUSD/USDC/USDT and $1.08 million for sUSG/reUSD, against $2.00 million for sUSDx/USDx — the one rate in the table with no incentive behind it at all.
Top Llamalend supply yields
| Chain | Market | Supply APY |
|---|---|---|
 |  crvUSD  CRV | 7.9% |
|  crvUSD  svZCHF | 6.5% |
| crvUSD  sUSDe | 5.0% |
| crvUSD sfrxUSD | 4.8% |
| crvUSD sDOLA | 4.6% |
| crvUSD  WETH | 4.6% |
| crvUSD  fxSAVE | 4.6% |
| crvUSD  syrupUSDC | 4.1% |
| crvUSD  WBTC | 3.9% |
| crvUSD  wstETH | 3.1% |
Top BTC and ETH yields
| Chain | Market | Asset | Est. APY |
|---|---|---|---|
|  ETH  ETHx | ETH | 4.3% |
|  ynETHx  WETH | ETH | 2.9% |
|  frxETH  sfrxETH | ETH | 2.8% |
|  cbBTC WBTC | BTC | 1.9% |
| WBTC cbBTC  hemiBTC | BTC | 1.7% |
 |  cbBTC  WBTC  LBTC | BTC | 1.1% |
Other top yields
| Chain | Market | Asset | Est. APY |
|---|---|---|---|
|  CRV  sdCRV | CRV | 10.9% |
| CRV  cvxCRV | CRV | 9.9% |
|  GHO cbBTC WETH | TRICRYPTO | 4.8% |
| crvUSD  ZCHF | FOREX | 4.2% |
| crvUSD  CJPY | FOREX | 2.7% |
 |  USDC.e  EURe (Monerium) | FOREX | 1.7% |
|  XAUt  PAXG | GOLD | 0.2% |
Protocol activity and stability
crvUSD remained close to peg at $0.9996. Minting rose 4.1% to $75.8 million and Llamalend borrowing rose 4.8% to $144 million, while PegKeeper reserves fell by $26.4 million to $15.8 million. That fall is the mechanism working rather than failing: with crvUSD a fraction below a dollar, the crvUSD/USDT PegKeeper pulled its own crvUSD back out of that pool, which is also why crvUSD/USDT shows the second-largest TVL drop of the week. Four of the five PegKeepers now hold nothing at all. DEX TVL, volume, swaps and fees fell as well, but those measure activity rather than protocol solvency.
crvUSD & scrvUSD
| Metric | Value | Weekly change |
|---|---|---|
| crvUSD Minted | $75.8M | +4.1% |
 scrvUSD Yield | 2.2% | +1.3 pp |
| crvUSD in scrvUSD | 21.1% | -0.6 pp |
| crvUSD Price | $0.9996 | -$0.0001 |
| Average borrow rate | 2.6% | +0.8 pp |
| Peg Stability Reserves | $15.8M | -$26.4M |
| PegKeeper Profit | $1.35k | -$3.24k |
| Fees | $31.5k | +59.7% |
Llamalend
| Metric | Value | Weekly change |
|---|---|---|
| 🦙 Llamalend TVL | $259M | +3.1% |
| 🦙 Supplied | $93.7M | +1.8% |
| 🦙 Borrowed | $144M | +4.8% |
| 🦙 Collateral | $233M | +4.4% |
| 🦙 Loans | 1147 | +7 |
| 🦙 Fees | $1.62k | +14.7% |
DEX
| Metric | Value | Weekly change |
|---|---|---|
| 🔄 TVL | $1.43B | -3.8% |
| 🔄 Volume | $776M | -1.7% |
| 🔄 Swaps | 353k | -6.7% |
| 🔄 Total Fees | $140k | -23.7% |
Fees here are DEX pool fees only; crvUSD minting fees and Llamalend fees appear in their own sections.
DAO
| Metric | Value | Weekly change |
|---|---|---|
| CRV Circ. Supply | 1.56B | +0.1% |
| CRV Locked | 850M | -0.1% |
 Total veCRV | 780M | +0.1% |
| veCRV Distribution | $88.5k | -6.6% |
| veCRV APR | 1.762% | +0.018 pp |
| CRV Emissions | $686k (1.86M CRV) | -5.4% |
| Inflation Rate | 4.023% | -0.765 pp |
Governance and protocol updates
YieldBasis BTC pools now charge one flat fee
The swap fee is what a trader pays and what liquidity providers earn. Until now it was not one number in these pools: it sat low while the pool was balanced and rose sharply as the pool drifted, so trades that unbalanced a pool paid much more. That is gone. A trade now costs the same whatever state the pool is in, which makes the cost predictable for traders and removes the extra payment providers used to collect from unbalancing trades. All three BTC pools had been put on the two-tier fee in August, wBTC by vote 1486 on the 17th and the other two by vote 1491 on the 29th; this vote undoes that for all of them at once.
Measured on chain after execution, all three pools read the same in both states: 1.30% balanced and 1.30% out of balance, against 1.28% and 3.28% before. The vote also retunes the policy layer that adjusts leverage — an 8 bp deadband and a 12–54 bp dynamic cap, in the DAO’s own wording; those parameters are quoted from the proposal, not measured here.
Explore Curve
Know someone tracking DeFi yields? Forward them this issue.
Risk information: pool risks, lending risks and crvUSD risks.
Comments

Powered by RoundtableBuilt on infrastructure designed for real-time media. Learn more at RTB.io.© Roundtable 2026. By using this site you agree to the Terms of Use and Privacy Policy